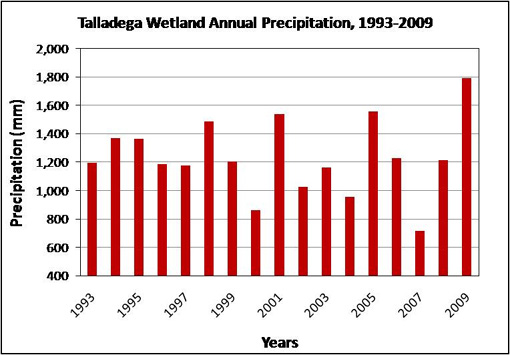
Annual
Annual precipitation at TWE averages 123.5 cm per year. Two strong drought years have occurred during our period of record, 2000 and 2007.
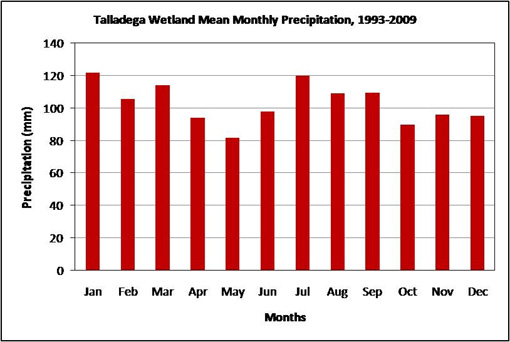
Seasonal
No clear seasonal patterns in precipitation exist here. However, rainfall is abundant during winter as a result of passing fronts, and frequently in summer-early fall due to tropical storms and hurricanes. In years without tropical storms, summer convectional driven precipitation can be low.